Overview:
Expanding Large Scale Wi-Fi Analytics Reporting
If you’ve got a Wi-Fi network with hundreds, thousands or tens of thousands of access points (APs), you’ve got to keep on top of a wide range of Key Performance Indicators (KPIs) associated with tens or hundreds of terabytes of data traffic that cross your network every day.
SmartCell Insight (SCI) lets you do it. Designed with large-scale service provider and enterprise networks in mind, SCI enables IT to extract insight from the network. That insight leads to better informed business and operational decisions.
RUCKUS SmartCell Insight (SCI) is a Big Data Wi-Fi analytics reporting engine designed for service providers and large enterprises to make informed business decisions regarding the health, operation and performance of their Wi-Fi networks. This service makes use of Big Data technology and storage innovations found in columnar database repositories, which greatly enhance the scale and performance of a system when used to process historical data.
The SCI Architecture
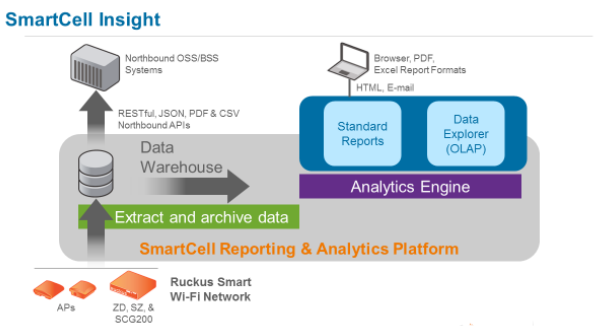
Figure 1 provides an overview of the SCI architecture. And as a VM based application, SCI provides four major functions:
- Network analytics aggregation – within the defined reporting scope, SCI interacts with APs and controllers to collect and archive key network metrics that become the backbone of the reporting capability.
- Monitor and report network status – based on established profiles, policies and standard reports, SCI automatically collects network data and generates the defined output.
- Data Explorer – a tool to create, customize and tailor reports to focus on the precise network metrics/trends to aid monitoring of the network.
- Export Analytics – SCI has built-in APIs that support straightforward exporting analytics to OSS/BSS systems that maybe part of the customer’s network. Reports can also be scheduled to be auto-delivered through e-mail in PDF and CSV formats
The RUCKUS SCI platform transforms traditional network reporting into a vital business tool by collecting, analyzing, parsing, reporting, and storing unprecedented amounts of user, traffic, session and application information. Data from the largest networks can be stored and retrieved for up to 5 years.
Dive deep into your network
SCI automatically collects data from across the network and generates reports based on established profiles and policies with data granularity- at 15-minute, 1-hour, or 24-hour increments.
Customize reports for your specific requirements
The Data Explorer feature in SCI allows you to create, customize and tailor reports with ease, so you can focus on just the network metrics and trends most important to you. Pick any combination of network dimensions and metrics.
Feed your business systems the data they need
With northbound APIs and data exporting capability, SCI is ready to integrate with existing BSS/OSS and to provide valuable network data to upstream business intelligence (BI) tools.
Benefits:
Scalable
The SmartCell Insight platform brings Big Data technology to Wi-Fi reporting and analytics through its ability to process massively large amounts of network metrics – up to 100,000 APs. Clustering VM service systems allows for massive scaling of the analytics scope.
Flexible
Generates reports locally and can export data to upstream OSS and BSS systems for maximum operations flexibility
Standard Reports
There is a huge inventory of predefined standard reports to get visibility into Wi-Fi network health, performance and Key Performance Indicators (KPI). These reports can be run on a defined schedule to simplify SCI configuration management.
Data Ecplorer Service
Any industry standard browser can be used to slice and dice the network analytics data to create custom reports utilizing Key Performance Indicators (KPIs) that reside in network archives on the SCI platform.
Ease of Use
The base VM design removes scaling limitations when additional capacity is required. There are no hardware appliance requirements. The capacity of SCI can be increased by adding new VMs to SCI and does not need a rip-andreplace to increase capacity.
Application Extensible
SCI delivers a set of APIs which can be used to construct custom applications based on the contents of the SCI analytics database.
Features:
Standardized SCI Reports
SCI ships with a set of standard reports that address the most common use cases faced by today’s large network operations team. There is an easy to use and elaborate filtering mechanism built into the SCI that allows customers to generate more specifically targeted reports. These reports can be printed, emailed, or copied to a PDF file. The following section looks at sample reports from each category.
User Activity
Traffic reports include: client fingerprint (iOS, Android, Windows, etc.), client health, number of sessions, number of unique devices, session bytes transferred, session duration, and top clients by traffic volume.
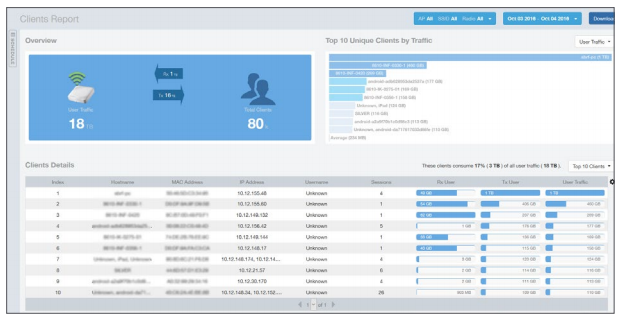
Figure 2 - Client Report
Operational Reports
Operational reports can be used to look at how the various elements in the network are performing.
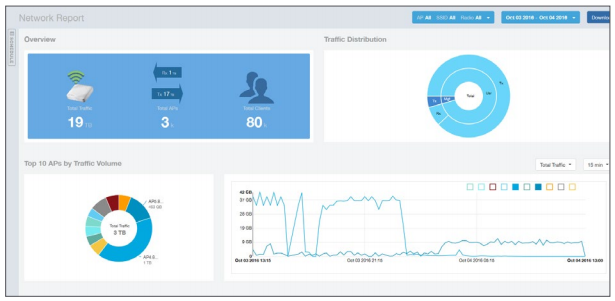
Figure 3 - Network activity - top ten APs by traffic
Inventory Reports
Inventory reports provide a mechanism to easily keep track of all the Wi-Fi assets in the network. These reports can be used to provide: access point inventory, WLAN controller inventory, and session inventory. RUCKUS SCI collects and aggregates statistics from up to hundreds of thousands of RUCKUS access points (APs), providing information such as upstream and downstream traffic demand, number of sessions, unique clients, or even the throughput customers can expect to achieve over periods of time on a per-AP basis. Now, network managers can quickly determine who is on their Wi-Fi network, what they are doing, when they are doing it, and from where; all graphically displayed in a simple format in a selection of views and customized reports.
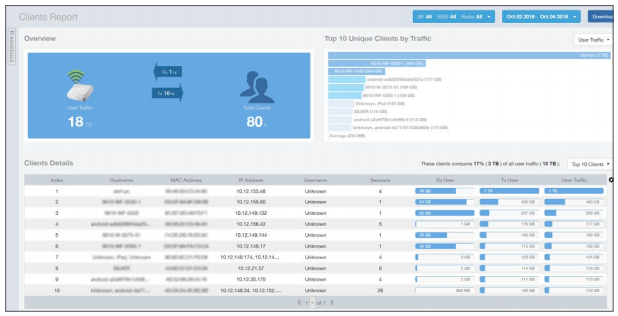
Figure 4 - Inventory Reports
For example, customers can get reports on the amount of traffic flowing through the network or any portion of the network, all the way down to the individual AP. This has never been possible on such a large scale as required by worldwide service providers, who are dealing with millions of devices.
As a VM application, SCI can be easily installed virtually anywhere within a provider’s infrastructure, integrating directly with existing OSS/BSS systems via northbound APIs.
Traffic Reports
Traffic reports include: access point traffic, client potential throughput, throughput estimate of clients, top APs by traffic volume, and top client devices by traffic volume. (Figure 5)
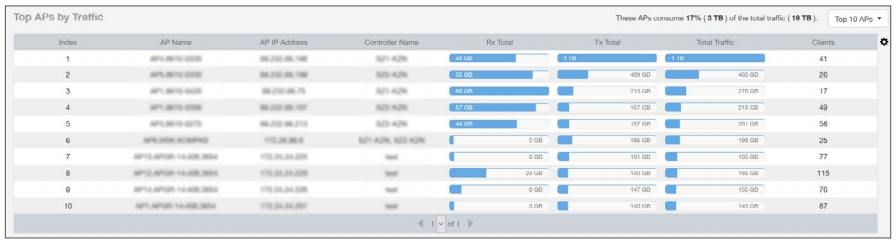
Figure 5 - Top APs by Traffic Data Explorer Reports
Data Explorer Reports
Easily generated from any standard browser, these custom reports make use of the broad range of network analytics archived in the SCI database. By defining the relationship and scope (e.g., AP, date, time, or other metrics) of selected elements and associated hierarchical order, reports can be generated to monitor almost any conceivable network analytic dynamic. This greatly enhances the value of SCI as it allows different groups within an organization to display data in ways that are most meaningful to their particular situation. The Data Explorer uses a very intuitive drag and drop interface allowing any user to create new reports in a matter of minutes. (Figure 6)
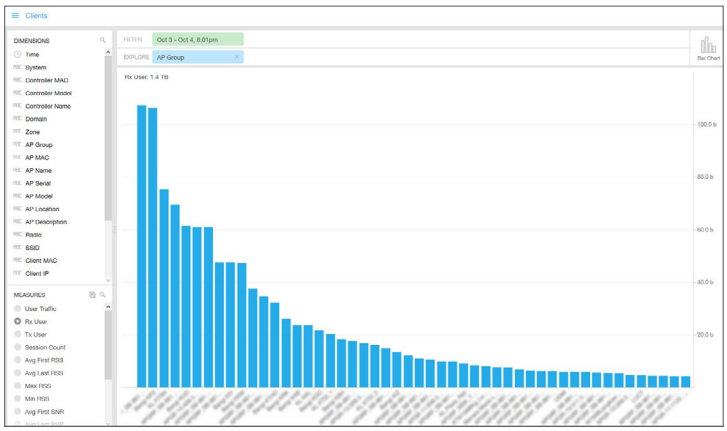
Figure 6 - AP Group activity
Airtime Utilization Reports
Wireless is shared medium by all clients, APs and other wireless devices. RF interference, number of clients, number of APs and other wireless devices affect the RF airtime utilization. Airtime utilization will provide visibility in to the utilization of 2.4GHz and 5GHz radios. You will be able to get airtime utilization at high level for overall network, as well as on per-radio at detailed level. You will be able to see trends and changes of Airtime utilization over time (Figure 7).
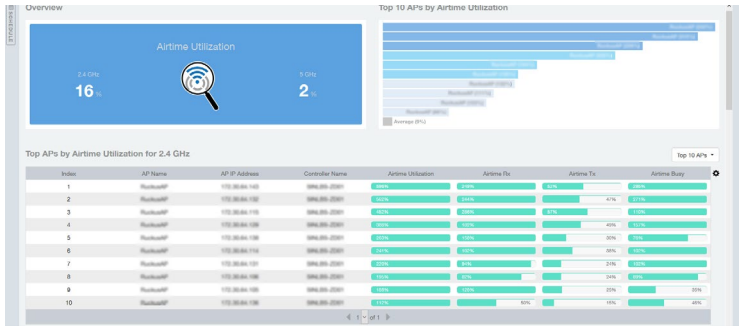
Figure 7 - Airtime Utilization Report
Top Applications by Traffic
Application visibility report will give visibility into usage of different applications in your network. You will able to find the top applications that are hogging the network bandwidth and applications that are heavily used. You will be able to get deeper insights into the usage of different applications (Figure 8).
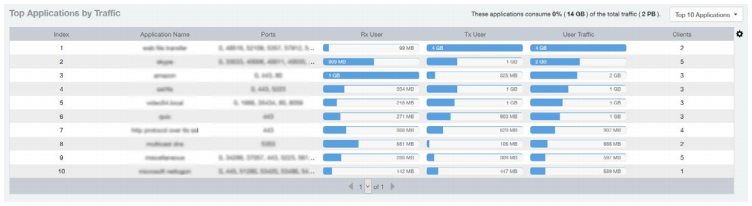
Figure 8 - Top Applications by Traffic
Greater Network Visibility
Getting the most from a large Wi-Fi network, once deployed, requires clear visibility into its performance and user activity, both at a very granular level of detail as well as aggregated level to measure global trends potentially spanning years.
SCI leverages two emerging trends:
Mobile Internet usage patterns which are evolving rapidly. The visibility required to address these changes must extend beyond typical shorthorizon EMS/NMS health and statistics to enable long-term trend analysis that supports network and service evolution planning. With exploding volumes of users, devices, traffic, and access points, this requirement spells a real scaling challenge for any network measurement and assessment tool.
Emergence of Big Data brought to market by many popular applications that facilitate the collection, storage, and efficient retrieval and analysis of massive amounts of data. This technology, built into SCI, results in a comprehensive offering that can accommodate additional capabilities in future releases.
These two trends are integrated into the RUCKUS SCI as a whole new approach to measurement and assessment, designed specifically to provide the visibility, trend analysis, and raw scale required to successfully manage a carrier-sized Wi-Fi network.
| Feature |
Description |
| Basic Operating Environment |
- VMware
- Amazon Web Services
- KVM
|
| Basic Architectural functions |
- Analytics aggregation
- Network monitor & reporting
- Creation of custom reports (Data Explorer)
- Export Analytics
|
| VM Cluster support |
Virtual limitless management capacity |
| Standard Reports |
| Inventory Management |
Reporting total APs and Controllers under management |
| Network Operations |
Reporting maximum and minimum statistics in various categories |
| User/session management |
Reporting client type, health, number and duration of sessions |
| Traffic Reports |
Total traffic by AP and client as defined by report scope |
SCI has been redesigned to make it simpler to trial, deploy and expand. The licensing has been changed to take advantage of the VM-based architecture, providing virtually limitless scaling utilizing “clustering” of VM resources. Additionally, support for APs can be purchased on individual basis and not in large, arbitrary block-order sizes. This allows a customer to deploy small pilot sites and then expand service solely based on the aggregate number of APs to support.
Trials are even simpler with the ability to download the trial SCI, install and operate it for 90 days with no limitation on features and number of APs being evaluated. This provides a straightforward opportunity to validate a complete site at no cost at all – no risk at all.